You should be able to:
* Create text (T) using the "text tool"
* Change text colors using the "color chips" in the "menu bar" and "tool box" as well as "side menus"
* Change size of text using the "font size" in the "menu bar" as well as using the "transformation" operation with the "selection tool".
* Use the "direct select and selection tool" to arrange/move text on the canvas.
* Apply "fills and strokes" to text.
* Apply "text warp" to text. (Found in menu-bar)
* "Delete" text from the canvas. (Using the delete button on keyboard or into the trashcan in the layerbox)
* Change "opacitiy" of text from the menu bar or side menus.
PROJECT DESCRIPTION
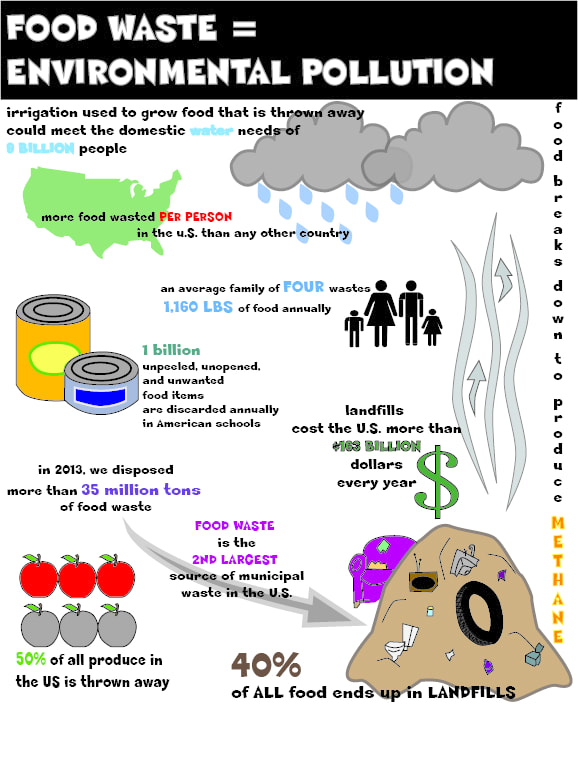
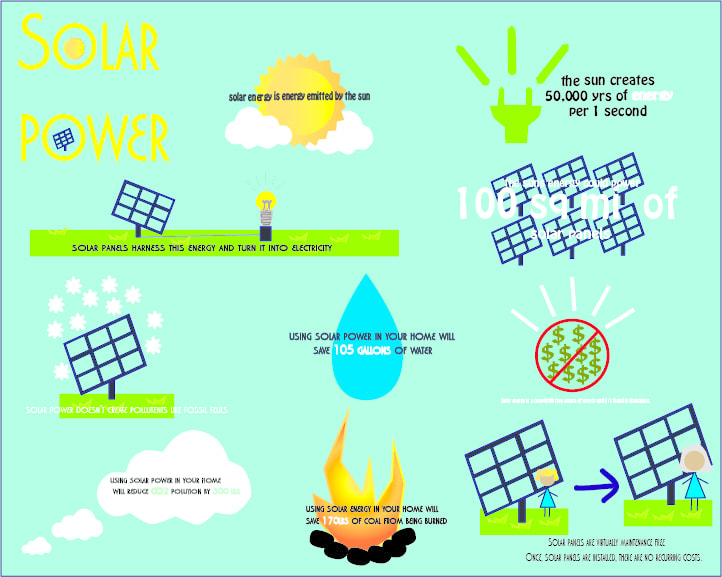
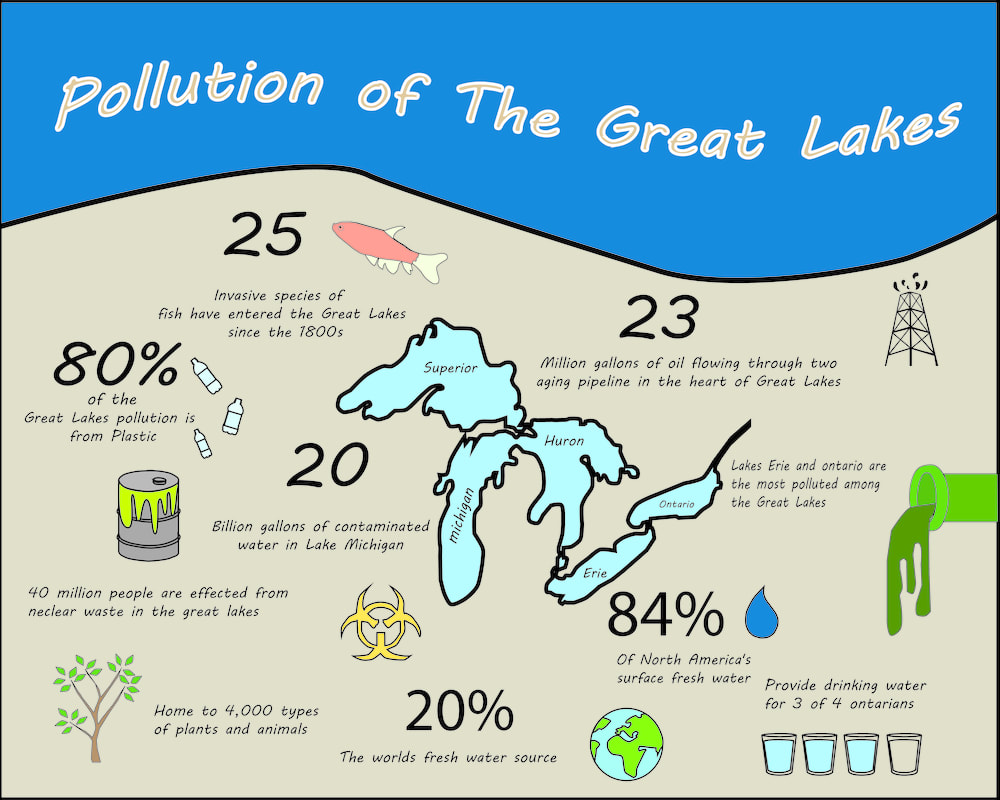
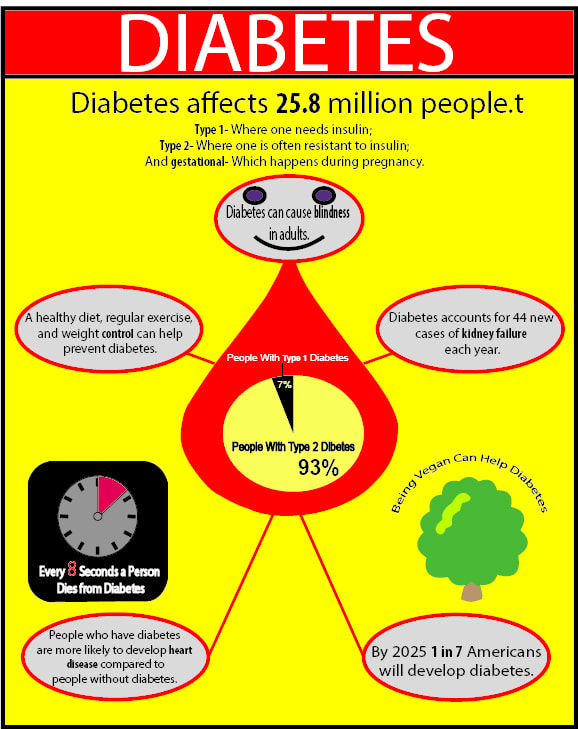
Infographic: Choose a relevant "Social Issue" and prove your position using researched facts. Support your facts using Fonts, Colors and Illustrations to effectively connect your information into a well constructed composition that is easily readable.
|
|
|
|
You will use Three seperate canvases on a single workspace:
CANVAS 1: *This is where you will store all your researched facts.
-10 Facts, 5 need to have a statistic in them.
-Place 7-8 examples of infographics that you like and may want to model your design after in the gray area around first canvas.
CANVAS 2: *This is where you will create the graphics/illustrations for your design.
CANVAS 3: *This canvas will be your actual design and can be an 8X10 or a 10X8 depending on your design.
-Minimum 8 Facts.
-Graphics to go with each Fact.
-Connectivity of fonts, colors and composition
-Easily readable
